Numerical models allow us to explore the interaction between active faults within the three-dimensional fault system.
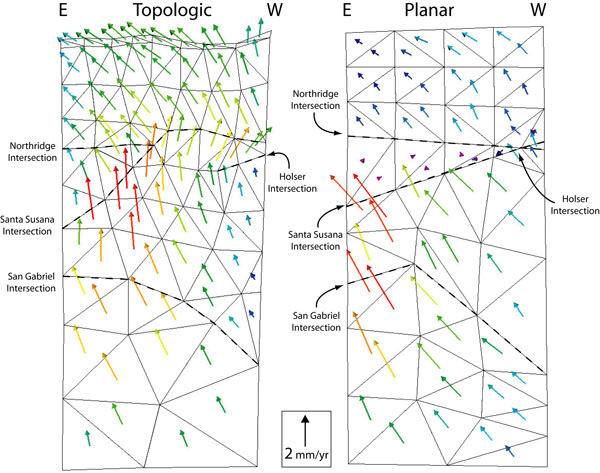
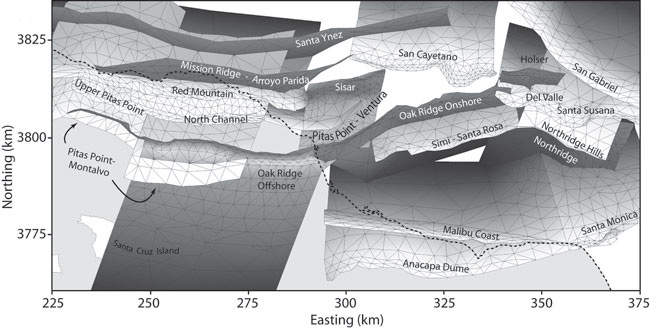
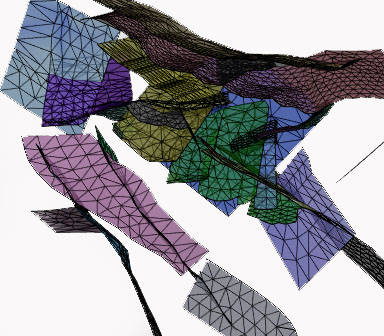
If we want to predict future earthquakes, we have to understand both the active fault configuration at depth in Southern California and how the faults work together accomodate plate motions. The UMass geomechanics team has worked in three regions of Southern California 1) the Los Angeles Basin, 2) the Ventura Basin (shown at left) and 3) the San Gorgonio knot region along the San Andreas fault. Each of these regions contains highly complex active fault geometry that require 3D investigation.
The Los Angeles Basin
 |
Slip rate distributions along faults can be
determined from 3D models of geologic deformation. Such numerical generated distributions reveal that the average slip rate along the fault can differ from the rate at specific paleoseismologic sites. Cooke, Michele and Scott Marshall, 2006. Slip rates on faults within the Los Angeles Metropolitan region, GRL, vol. 33, L21212, doi:10.1029/2006GL027850..
The subsurface active fault configuration is poorly costrained in much of southern California. We can assess between alternative fault geometries, by evaluating fit to 1) geologic slip rates (Griffith and Cooke, 2004. Mechanical validation of the three-dimensional intersection geometry between the Puente Hills blind-thrust system and the Whittier fault, Los Angeles, California , BSS, vol 94 pp. 493-505.) and 2) uplift patern (Meigs, Cooke and Marshall, 2008. Using vertical rock uplift patterns to constrain the three-dimensional fault configuration in the Los Angeles Basin, BSSA, vol 98, pp 106-123, doi: 10.1785/0120060254)
Scott Marshall is currently working on interseismic models of the Los Angeles basin that will compare model predictions to observed GPS station velocities. |
Clicking the image above will download 3D PDF file of active faults in the Los Angeles basin of Southern California made by Dr. Scott Marshall.
This interactive image can be viewed with Adobe Acrobat version 7.0 or later.
Acrobat Reader allows you to manipulate and rotate 3D PDF images
The San Gorgonio knot region along the San Andreas
Through the San Bernardino Mountains the San Andreas Faults apears to have a complex 3D shape, yet most models for seismic hazard analysis incorporate a vertical and continuous fault surface in this region. Laura Dair has shown that 3D models that incirporate a north dipping and complex configured San Andreas fault through the San Bernardino Mountains better match strike-slip and uplift rates (Dair and Cooke, Geology 2009)
Evolution of the San Gorgonio knot
The geologic strike-slip rates along the San Andreas fault through the San Gorgonio Pass are well-matched by slip rates from the 3D forward models. The San Andreas fault has abandonned two active strands in the past 1 Ma. The models show that mechanical efficiency increasesduring the transition from the Mission Creek to the Mill Creek strand but seems to decrease with the transiion to the present-day geometry.
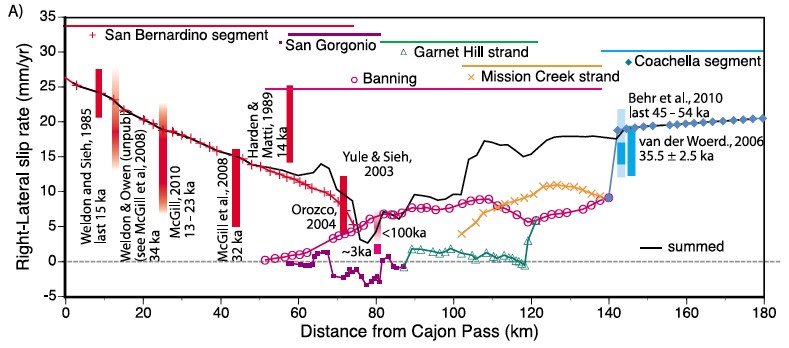
Cooke, M. L., and L. C. Dair (2011), Simulating the recent evolution of the southern big bend of the San Andreas
fault, Southern California, J. Geophys. Res., 116, B04405, doi:10.1029/2010JB007835.