|
|
Science Overview
Project Background
Two ice cores to bedrock (132.5 m) were retrieved from the summit of the Andean volcano Sajama in July 1997 by L.G. Thompson and his team from Ohio State University (summit elevation 6,542 m at 18°06' S and 68°53' W). In anticipation of this effort, our UMass Geosciences group installed an automated, satellite-linked weather station (AWS) close to the drill site in October of the previous year, with the objective of improving the 'climate calibration' of geochemical variations in tropical ice cores. A second AWS site was selected on Nevado Illimani (6,265 m elevation at 16°39' S and 67°47' W) to provide meteorological and snow data 'upwind' from Sajama; a drilling campaign is anticipated there within the next few years.
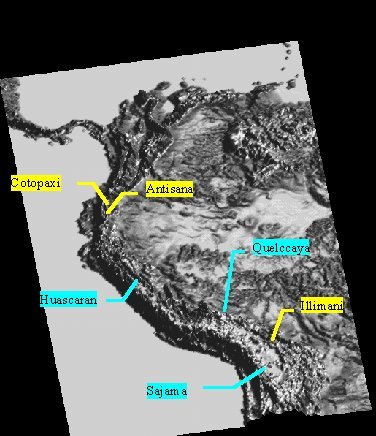 | Location of Sajama and Illimani, to the west and east of the Altiplano, respectively. Ice cores have been obtained from sites labeled in blue; planned sites are labeled in yellow. |
Meterological Observations
Data acquisition at these remote stations has been quite successful, given that they operate at over 1000 m higher than any other weather station on either continent of the Americas. For most variables measured on Sajama, the data are nearly continuous since October 1996. The Illimani station was knocked out by a lightning strike two months after installation, but was repaired on the next visit (May 1998). Satellite telemetry (via GOES) has been interrupted on several ocassions due to a transmitter glitch, but we have experienced much greater reliability following recent hardware and software changes.
Following the installation in October 1996, visits to the Sajama station were made in late June/early July of 1997, and again 10 months later during late April/early May of 1998. Illimani was climbed following both of these expeditions. We anticipated only one annual expedition to the stations, but three trips within 19 months were deemed necessary for two reasons. First, precipitation during the 1996-97 wet season on the Altiplano was higher than normal. Greater than anticipated snow accumulation (~4 m) resulted in burial of the stations lowest sensors by the end of this first wet season. In response, eight days of work were conducted at the site (esp. digging snow) in conjunction with the Ohio State University ice-core drilling operation. Second, transmissions from the station to GOES ceased on 18 December 1997, just as the current El Niño event became mature. We therefore returned to the station as soon as conditions on the mountain allowed, to restore telemetry and insure that the station was still recording data through this important period. Four days were spent at the summit on this second visit -- and indeed data had been continuously recorded on-site.
Meteorological observations from both stations are being analyzed in terms of the climate at the summit (e.g. Hardy et al., 1998), in the context of large scale upper-air circulation (e.g. Vuille et al., 1998a and 1998b), and in conjunction with the results of snowpit studies (e.g. Hardy et al., 1998b).
Snowfall Events & Snow Geochemistry
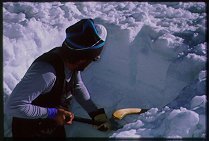
Snow studies and sampling were carried out at the Sajama AWS site during both visits. In July of 1997, a suite of samples to a depth of 1.53 m was obtained from a snowpit adjacent to the station. The sampling interval was ~6.4 cm, and samples were transported frozen along with the ice core shipment, by the Ohio State team. A more detailed snowpack analysis was possible in May 1998, due less time required for digging at the AWS, lower wind speeds, and less accumulation. The snowpack stratigraphy was examined in detail, followed by continuous sampling at an interval of 3 cm. Snow samples were kept frozen through the descent, and during transport to the ice core storage facility at Ohio State University. In addition, a lightweight hand auger was used to obtain two short cores. Both were cut into segments for transport, and later melted for isotopic analysis.
Snow sampling through the 1997-98 accumulation was closely integrated with stratigraphic examination of the snowpack, and a continuous hourly record of snow accumulation and ablation was recorded nearby at the AWS by two different sensors. The AWS data and stratigraphic measurements are enabling the time of deposition for each snow sample to be resolved, thereby tying samples to snowfall events. Based upon the large-scale circulation and airmass trajectory during each event (determined as for 1996-97), we are associating unique geochemical properties for each snowfall with weather patterns (synoptic situations) at the time.
First Results
Sajama data have demonstrated that climatic conditions associated with snowfall events vary significantly throughout the year (Hardy et al., 1998). Since highly variable conditions can attribute to snowfall on Sajama during the austral summer months, understanding the geochemical composition of snow during different circulation patterns requires examination of individual snowfall events or periods. For example, on the basis of the analysis of midtropospheric circulation associated with 17 precipitation events recorded on Sajama during the 1996/1997 summer season, four major synoptic situations were distinguished. While highly convective situations prevailed during most of December and January, significant moisture influx from remote areas, particularly to the east, occurred during February and most of March, as indicated by transit time analysis at the 400 hPa level (Vuille et al., 1998). The different synoptic situations can best be distinguished by the change in the position of the maximum geopotential height in the 400 hPa level (Bolivian High). The unusual position of this high-pressure system during the 1996-97 wet season is the main reason for the anomalously high precipitation amounts over most of the Altiplano.
The first year of measurements on Sajama reflects conditions which were colder and wetter than the long-term average (Hardy et al., 1998). At La Paz El Alto, for example, the surface temperature was more than one standard deviation below normal in all except three months of the period October 1996 to September 1997. The greatest departures were during December, March and April, when mean monthly temperatures were the lowest of the period of record (79 years). The period of November 1996 through March 1997 was also wetter than normal on the Altiplano of Bolivia. Precipitation was above the median in all five months, accounting for the unexpectedly high accumulation at the Sajama station. The March total at La Paz El Alto (146 mm) was the fifth highest of the past 100 years. Precipitation during the austral fall and winter was normal in the context of the past 30 years, but the total for September of 1997 was again unusually high.
Further Work
Station data are helping to develop a more comprehensive view of climatic conditions at high altitudes in this remote part of the tropical Andes, yet alone these cannot resolve large-scale atmospheric circulation anomalies and air flow patterns, which considerably influence the geochemistry of snow deposited on Sajama's ice cap. Therefore, additional large-scale circulation analyses are being carried out to detect source regions of precipitation, and the primary trajectories of water vapor transport. We are also developing a data base of longer-term weather station, radiosonde, and sea-surface data from the Altiplano and adjacent regions, which will be useful in placing the observed record in a longer term perspective, as well as providing evidence of recent variations in climate (Vuille current research).
This project is providing unique datasets, spanning one of the most extraordinary ENSO events this century. Measurements at the Sajama station have been continuous from prior to the 1997-98 El Niño event, into the next phase of the oscillation. A preliminary comparison between 1996-97 and 1997-98 aspirated air temperature measurements suggests a significant difference between the two years.
visit our data page.
This project would not be possible without them!
![]()
| Return to UMass Bolivia |  |
Climate & Snow Home Page |
Document maintained by Doug Hardy (dhardy@geo.umass.edu)
Last updated: 10 October 1998
http://www.geo.umass.edu/climate/bolivia/science.html