Climatic Extremes in the Northeast United States
Michael Griffiths
Advisor: Raymond Bradley
Introduction
The Northeast region of the United States is home to some of the most
extreme and variable weather and climate in the world. This includes extremes
of both high and low temperatures, droughts, heavy rainfall, hurricanes,
tornadoes, blizzards, and more. These great variations of weather and climate
in this region are influenced by many factors related to the physical geographical
setting, including the regions latitude and coastal orientation (Keim,
1998).
Mean annual temperature (MAT) varies substantially across the northeast.
The coldest locations are in northernmost Maine, whereas the southern parts
of Pennsylvania and New Jersey are the warmest. Mean annual precipitation
varies from about 890 mm in the more interior part of the region to over
1270 mm along some coastal areas. Greater seasonality of temperature (higher
summer and lower winter temperatures) is a function of the degree of continentality
of the climate. A greater annual range occurs in the interior-most parts
of the region (Zielinski and Keim, 2003).
Climate in the northeast region of the United States has varied substantially
over the past two centuries. This time period was characterized by the
end of the so-called Little Ice Age and the onset of a warming trend,
in the twentieth century that is most likely a result of anthropogenic
increases in greenhouse gases (IPCC, 2001). In addition, some of the warmest
and coldest, plus wettest and driest, periods of the past millennium have
been recorded during this time interval. These periods of changing climate
have been recorded by both instrumental records (which extend back to the
late 18th century in some areas) and also by natural proxies. These proxies
include pollen records and, more commonly, tree-ring records.
Study Area
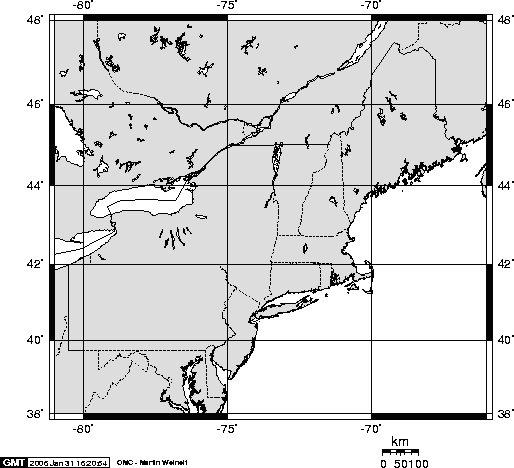
The area of study (Fig. 1), which is located in the northeast quadrant
of the United States, includes the six New England states (Maine, New Hampshire,
Vermont, Massachusetts, Connecticut, and Rhode Island) as well as three
nearby states (New York, Pennsylvania, and New Jersey). The study area
extends from 38° 55 N to 47° 22 N and from 67° 15 W to 80°
30 W and ranges in elevation from sea level to 1,917 meters (summit of
Mount Washington). Topographically, this region is partly delineated from
the rest of the nation by the Appalachian Mountains to the west. From the
Green Mountains, the White Mountains, and Berkshire Hills, the land surface
slopes gradually toward the Atlantic Ocean.
Objectives
In this study my objectives are as follows:
Create a database of long term instrumental monthly climate data
(temperature, precipitation) from as many stations as possible in the study
area, which have a period of record that
extends at least thirty years into the 19th century. This data will be
compiled from a variety of online sources.
Analyze and adjust these instrumental climate data for inhomogeneities
using a variety of statistical techniques.
Obtain a small network of daily records for the study area and use
this data to identify episodic climate extremes based on a set of climatic
extreme parameters developed by the European Climate Assessment (ECA) group.
Examine the frequency and intensity of extreme climatic events (e.g.
extreme cold events) related to natural processes (e.g. volcanic events),
and modes of large-scale atmospheric circulation (e.g. ENSO, PDO, NAO).
Climate Extremes
A large set of climatic extreme indicators were developed by the European
Climate Assessment (ECA) group following a set of global meetings. The
rationale for the development of these indicators was to provide the base
line data for evaluating climate change scenarios worldwide in the future.
This large list was refined to 10 extreme indicators (nine are used in
this study) by Frich et al (2002), all of which could be applied to a large
variety of climates. The indicators are based on daily minimum and maximum
temperature series, as well as daily totals of precipitation, and represent
changes in all seasons of the year. For a full list of all the ECA indicators
and for full descriptions used in this study refer to the ECA website at
http://www.knmi.nl.samenw/eca/htmls/index2.html .
The extreme indicators associated with temperature include:
i) Frost Days (FD): measures air frosts, which will sample the
winter half year in all extra-tropical regions, particularly the beginning
and end of the cold season.
ii) Intra-annual Extreme Temperature Range (ETR): will span
the most extreme high temperature event of the summer season and the most
extreme low temperature event of the winter season.
iii) Heat Wave Duration Index (HWDI): samples the daytime maxima
throughout the year in most climates.
iv) Tn90: is the percent of observations exceeding the daily
90th percentile for the 1961-1990 base-periods, which will sample primarily
the warm nights during the year.
v) Length of the thermal Growing Season Length (GSL): will sample
spring and fall anomalies in the higher latitudes (Frich et al., 2002).
The extreme indicators associated with precipitation include:
i) The maximum number of Consecutive Dry Days (CDD): This will
potentially be a valuable drought indicator for the dry part of the year.
ii) R10: The number of days with precipitation > 10mm.
iii) The Simple Daily Intensity Index (SDII): This will summarize
the wet part of the year.
iv) R5d: The greatest 5 day precipitation total of the year:
This will represent some of the more extreme precipitation events of the
year (Frich et al, 2002).
v) R95T: Fraction of annual total precipitation due to events
exceeding the 1961-90 95th percentile.
Significance
The proposed research will generate a high quality dataset that will
help to resolve current uncertainties associated with climate extremes
in New England and adjacent states from the late 19th century to present.
Climate extremes play an integral role in everyday life for people not
only in the northeast United States, but all around the world. If we can
better understand the relative periodic patterns of climate extremes in
the past for the region, we can gain a clearer understanding of future
patterns of climate extremes, and also assess the linkages between these
extremes and other periodic modes of climatic variation such as ENSO, NAO
and PDO. In addition, these climate extremes may be linked to natural events
such as volcanic events and variations in solar radiation, as well as anthropogenic
forcing mechanisms.
In addition to the assessment of these climate extremes, the adjusted
instrumental data will be used to create a spatially and temporally detailed
19th century climate database for New England and adjacent states, in a
NOAA funded project involving R.S Bradley (University of Massachusetts),
A. Kaplan (Lamont-Doherty Earth Observatory) and G.A. Zielinski (University
of Maine). In this project, complementary sets of instrumental and historical
data will be used to provide a comprehensive network of 19th century data
for the region.
References
Frich, P., L.V. Alexander, P. Della-Marta, B. Gleason, M. Haylock,
A.M.G. Klein, and T. Peterson, 2002: Observed Coherent changes in climatic
extremes during the second half of the twentieth century. Climate Research,
19:193-212.
IPCC (2001) Climate Change 20001: the Scientific Basis Contribution of Working Group I to the third Assessment Report on the Intergovernmental Panel on Climate Change. J.T.
Keim, B., 1998: Extreme Climatic Events in New England History. New Englands Changing Climate, Weather, and Air Quality, http://www.neci.sr.unh.edu/neccwaq.html#10
Zielinski, G.A., and B.D. Keim, 2003: Seasons of New England, New England Weather, New England Climate, CH 11, p124. University Press of New England.
return to homepage