 |
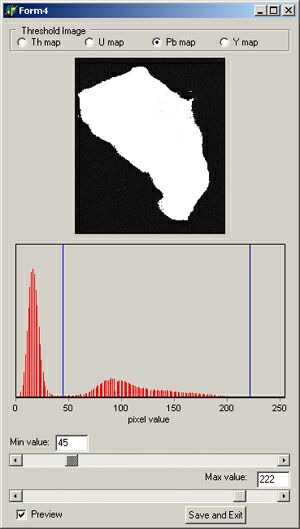
Creation of a mask
The calibration and age
calculation procedure requires to build a separate mask image to avoid
calculation using matrix pixels, in order to eliminate "unrealistic
ages". The mask is created by applying a threshold processing, included
with the Age Map program, on one of the raw element images selected
by the user.
Consequently, calculations for image manipulation
are carried out only on pixels corresponding to white pixels in the threshold
map.
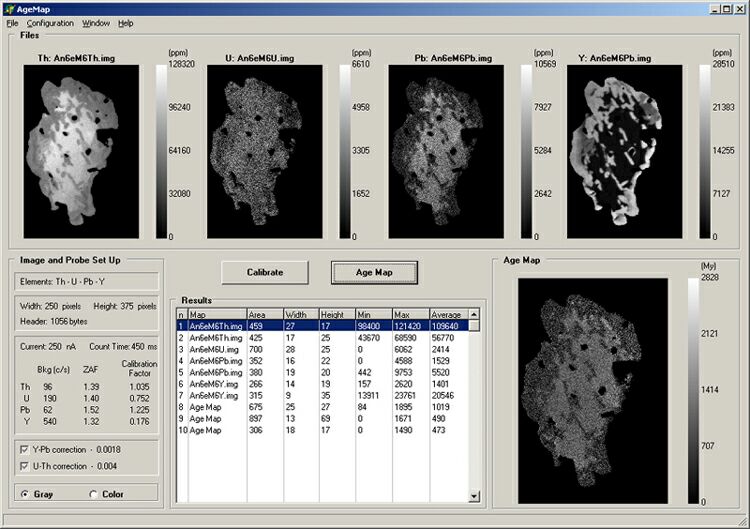
Calibration of the compositional
maps
The values of each pixel
in raw X-ray maps, as they are stored from the microprobe, represent total
accumulated counts (peak + background). For calibrated age maps, these
total counts are converted to concentration in ppm:
1) First,
background intensities (in counts per second) are subtracted from total
counts. We apply a constant, previously determined or estimated, background
value to the full map.
2) After background
subtraction, pixel intensities are adjusted using a ZAF factor determined
from previous quantitative analysis.
3) Finally,
concentrations are obtained by referencing the intensities in counts per
second per nanoampere (c/s/nA) of each pixel to standard intensities according
to the equation
Conc(unk)
= I(unk) * (Conc(std) / I(std))
where Conc is in ppm and I in c/s/nA. The ratio Concstd / Istd is denominated
as the 'Calibration Factor' in our AgeMap program.
|
|
Age map calculation
Before calculating the age
map, an empirical correction for two interelement interferences (Pb Ma-
Y Lg and Th Mg - U Mb ) is applied using the general equation:
Correc(peak) = Meas(peak) - Meas(peak-interf)
An age map is calculated using the intensity
of each pixel (in ppm) in the equation of Montel (1996), which is solved
iteratively. Each calculated "age" (in millions of years) is
stored in the corresponding pixels of the new age map.
|
|
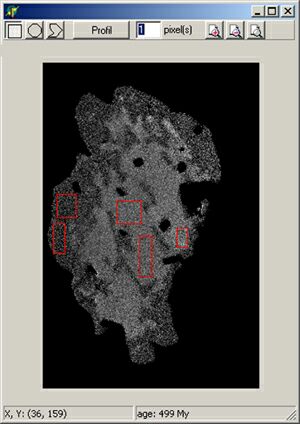
AgeMap program includes
several image analysis functions that can be applied to all image types
(raw images, calibrated compositional maps and age maps). At runtime,
the user has access to pixel coordinates and the associated pixel values
(total counts, ppm or age) at the pointer location.
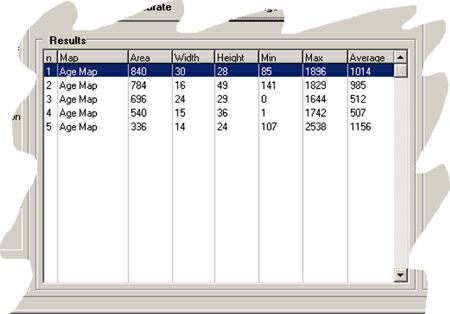
Areas within maps can be selected and average
pixel values, mimimal and maximal pixel value within that area are in
the window results).
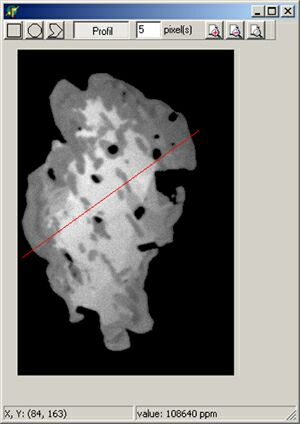
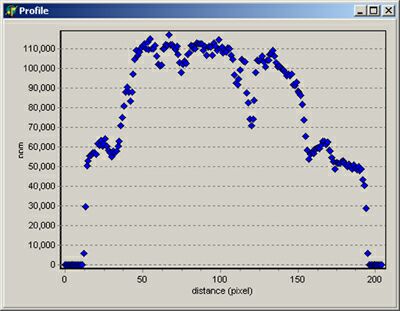
AgeMap program also
includes a profile tool that displays in a graph the intensities of pixels
(counts, ppm or age) along a line within the image. To limit noise, the
width of the profile can be set to values greater than one pixel (see
below).
|