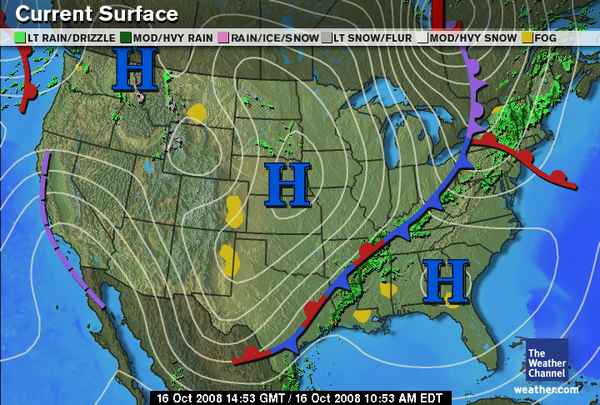
Below is the surface weather map for October 16, 2008. The white contours are isobars of sea level pressure. The green shading is the radar estimate of precipitation.
2. What is the most probable type of the air mass in southwestern New Mexico? What leads you to that assumption?
3. Where in the United States would you expect to observe the highest sea level pressure? Be specific as to the part of a state.
4. Where in the United States would you expect to observe the lowest sea level pressure?
5. Where in the U.S. would you expect to observe high wind velocities? Why?
6. Where in the U.S. would you find near calm conditions? Why?
7. In what region of the U.S. would the wind be from the north? In what region of the U.S. would the wind be from the east?
8. For a location in central Texas, toward which direction would the pressure gradient force (only) be acting?
9. Identify the key lift mechanism and briefly (1-2 sentences max) describe why precipitation is falling north of the warm front.
10. Describe the processes causing lift across West Virginia. How does vertical ascent rate, basically the amount of lift, there compare to the lift over New York State?
11. Describe how you expect the weather to change in southern Ohio as the day progresses.
12. Where on the map would you expect surface convergence to be occurring? Why?
13. Where on the map would you expect surface divergence to be occurring? Why?
14. Where on the map would you expect a trough at upper levels of the atmosphere to be located? Why?